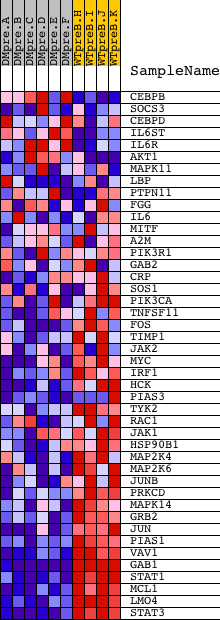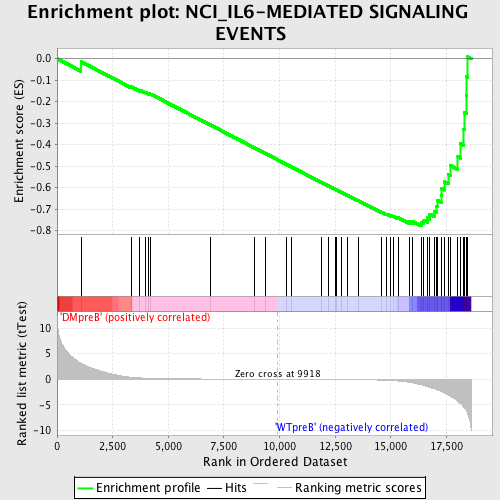
Profile of the Running ES Score & Positions of GeneSet Members on the Rank Ordered List
| Dataset | Set_04_DMpreB_versus_WTpreB.phenotype_DMpreB_versus_WTpreB.cls #DMpreB_versus_WTpreB |
| Phenotype | phenotype_DMpreB_versus_WTpreB.cls#DMpreB_versus_WTpreB |
| Upregulated in class | WTpreB |
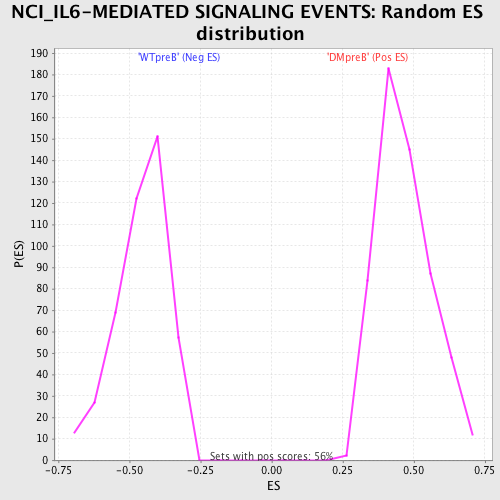
| GeneSet | NCI_IL6-MEDIATED SIGNALING EVENTS |
| Enrichment Score (ES) | -0.77881205 |
| Normalized Enrichment Score (NES) | -1.7051594 |
| Nominal p-value | 0.0 |
| FDR q-value | 0.009741894 |
| FWER p-Value | 0.098 |
| PROBE | DESCRIPTION (from dataset) | GENE SYMBOL | GENE_TITLE | RANK IN GENE LIST | RANK METRIC SCORE | RUNNING ES | CORE ENRICHMENT | |
|---|---|---|---|---|---|---|---|---|
| 1 | CEBPB | 8733 | 1073 | 3.127 | -0.0139 | No | ||
| 2 | SOCS3 | 20131 | 3325 | 0.381 | -0.1298 | No | ||
| 3 | CEBPD | 22846 | 3715 | 0.270 | -0.1469 | No | ||
| 4 | IL6ST | 4920 | 3953 | 0.221 | -0.1566 | No | ||
| 5 | IL6R | 1862 4919 | 4109 | 0.198 | -0.1621 | No | ||
| 6 | AKT1 | 8568 | 4218 | 0.183 | -0.1654 | No | ||
| 7 | MAPK11 | 2264 9618 22163 | 6872 | 0.045 | -0.3076 | No | ||
| 8 | LBP | 14760 | 8893 | 0.013 | -0.4162 | No | ||
| 9 | PTPN11 | 5326 16391 9660 | 9360 | 0.007 | -0.4412 | No | ||
| 10 | FGG | 1891 | 10299 | -0.005 | -0.4916 | No | ||
| 11 | IL6 | 16895 | 10534 | -0.008 | -0.5041 | No | ||
| 12 | MITF | 17349 | 11903 | -0.028 | -0.5774 | No | ||
| 13 | A2M | 17298 | 12200 | -0.034 | -0.5928 | No | ||
| 14 | PIK3R1 | 3170 | 12502 | -0.041 | -0.6084 | No | ||
| 15 | GAB2 | 1821 18184 2025 | 12548 | -0.043 | -0.6103 | No | ||
| 16 | CRP | 8793 | 12768 | -0.048 | -0.6214 | No | ||
| 17 | SOS1 | 5476 | 13046 | -0.056 | -0.6355 | No | ||
| 18 | PIK3CA | 9562 | 13540 | -0.075 | -0.6610 | No | ||
| 19 | TNFSF11 | 21745 | 14594 | -0.165 | -0.7154 | No | ||
| 20 | FOS | 21202 | 14800 | -0.201 | -0.7236 | No | ||
| 21 | TIMP1 | 24366 | 14994 | -0.238 | -0.7307 | No | ||
| 22 | JAK2 | 23893 9197 3706 | 15111 | -0.267 | -0.7332 | No | ||
| 23 | MYC | 22465 9435 | 15334 | -0.330 | -0.7405 | No | ||
| 24 | IRF1 | 1336 1258 1433 9182 | 15819 | -0.564 | -0.7586 | No | ||
| 25 | HCK | 14787 | 15979 | -0.695 | -0.7574 | No | ||
| 26 | PIAS3 | 15491 672 1906 | 16377 | -1.079 | -0.7637 | Yes | ||
| 27 | TYK2 | 12058 19215 | 16487 | -1.199 | -0.7527 | Yes | ||
| 28 | RAC1 | 16302 | 16651 | -1.434 | -0.7414 | Yes | ||
| 29 | JAK1 | 15827 | 16753 | -1.590 | -0.7245 | Yes | ||
| 30 | HSP90B1 | 19657 | 16950 | -1.834 | -0.7093 | Yes | ||
| 31 | MAP2K4 | 20405 | 17051 | -1.981 | -0.6869 | Yes | ||
| 32 | MAP2K6 | 20614 1414 | 17087 | -2.043 | -0.6601 | Yes | ||
| 33 | JUNB | 9201 | 17261 | -2.350 | -0.6365 | Yes | ||
| 34 | PRKCD | 21897 | 17290 | -2.395 | -0.6044 | Yes | ||
| 35 | MAPK14 | 23313 | 17421 | -2.682 | -0.5738 | Yes | ||
| 36 | GRB2 | 20149 | 17590 | -3.055 | -0.5400 | Yes | ||
| 37 | JUN | 15832 | 17687 | -3.335 | -0.4984 | Yes | ||
| 38 | PIAS1 | 7126 | 18015 | -4.270 | -0.4561 | Yes | ||
| 39 | VAV1 | 23173 | 18136 | -4.751 | -0.3959 | Yes | ||
| 40 | GAB1 | 18828 | 18283 | -5.430 | -0.3276 | Yes | ||
| 41 | STAT1 | 3936 5524 | 18294 | -5.505 | -0.2509 | Yes | ||
| 42 | MCL1 | 15502 | 18395 | -6.138 | -0.1702 | Yes | ||
| 43 | LMO4 | 15151 | 18404 | -6.210 | -0.0835 | Yes | ||
| 44 | STAT3 | 5525 9906 | 18455 | -6.760 | 0.0087 | Yes |